
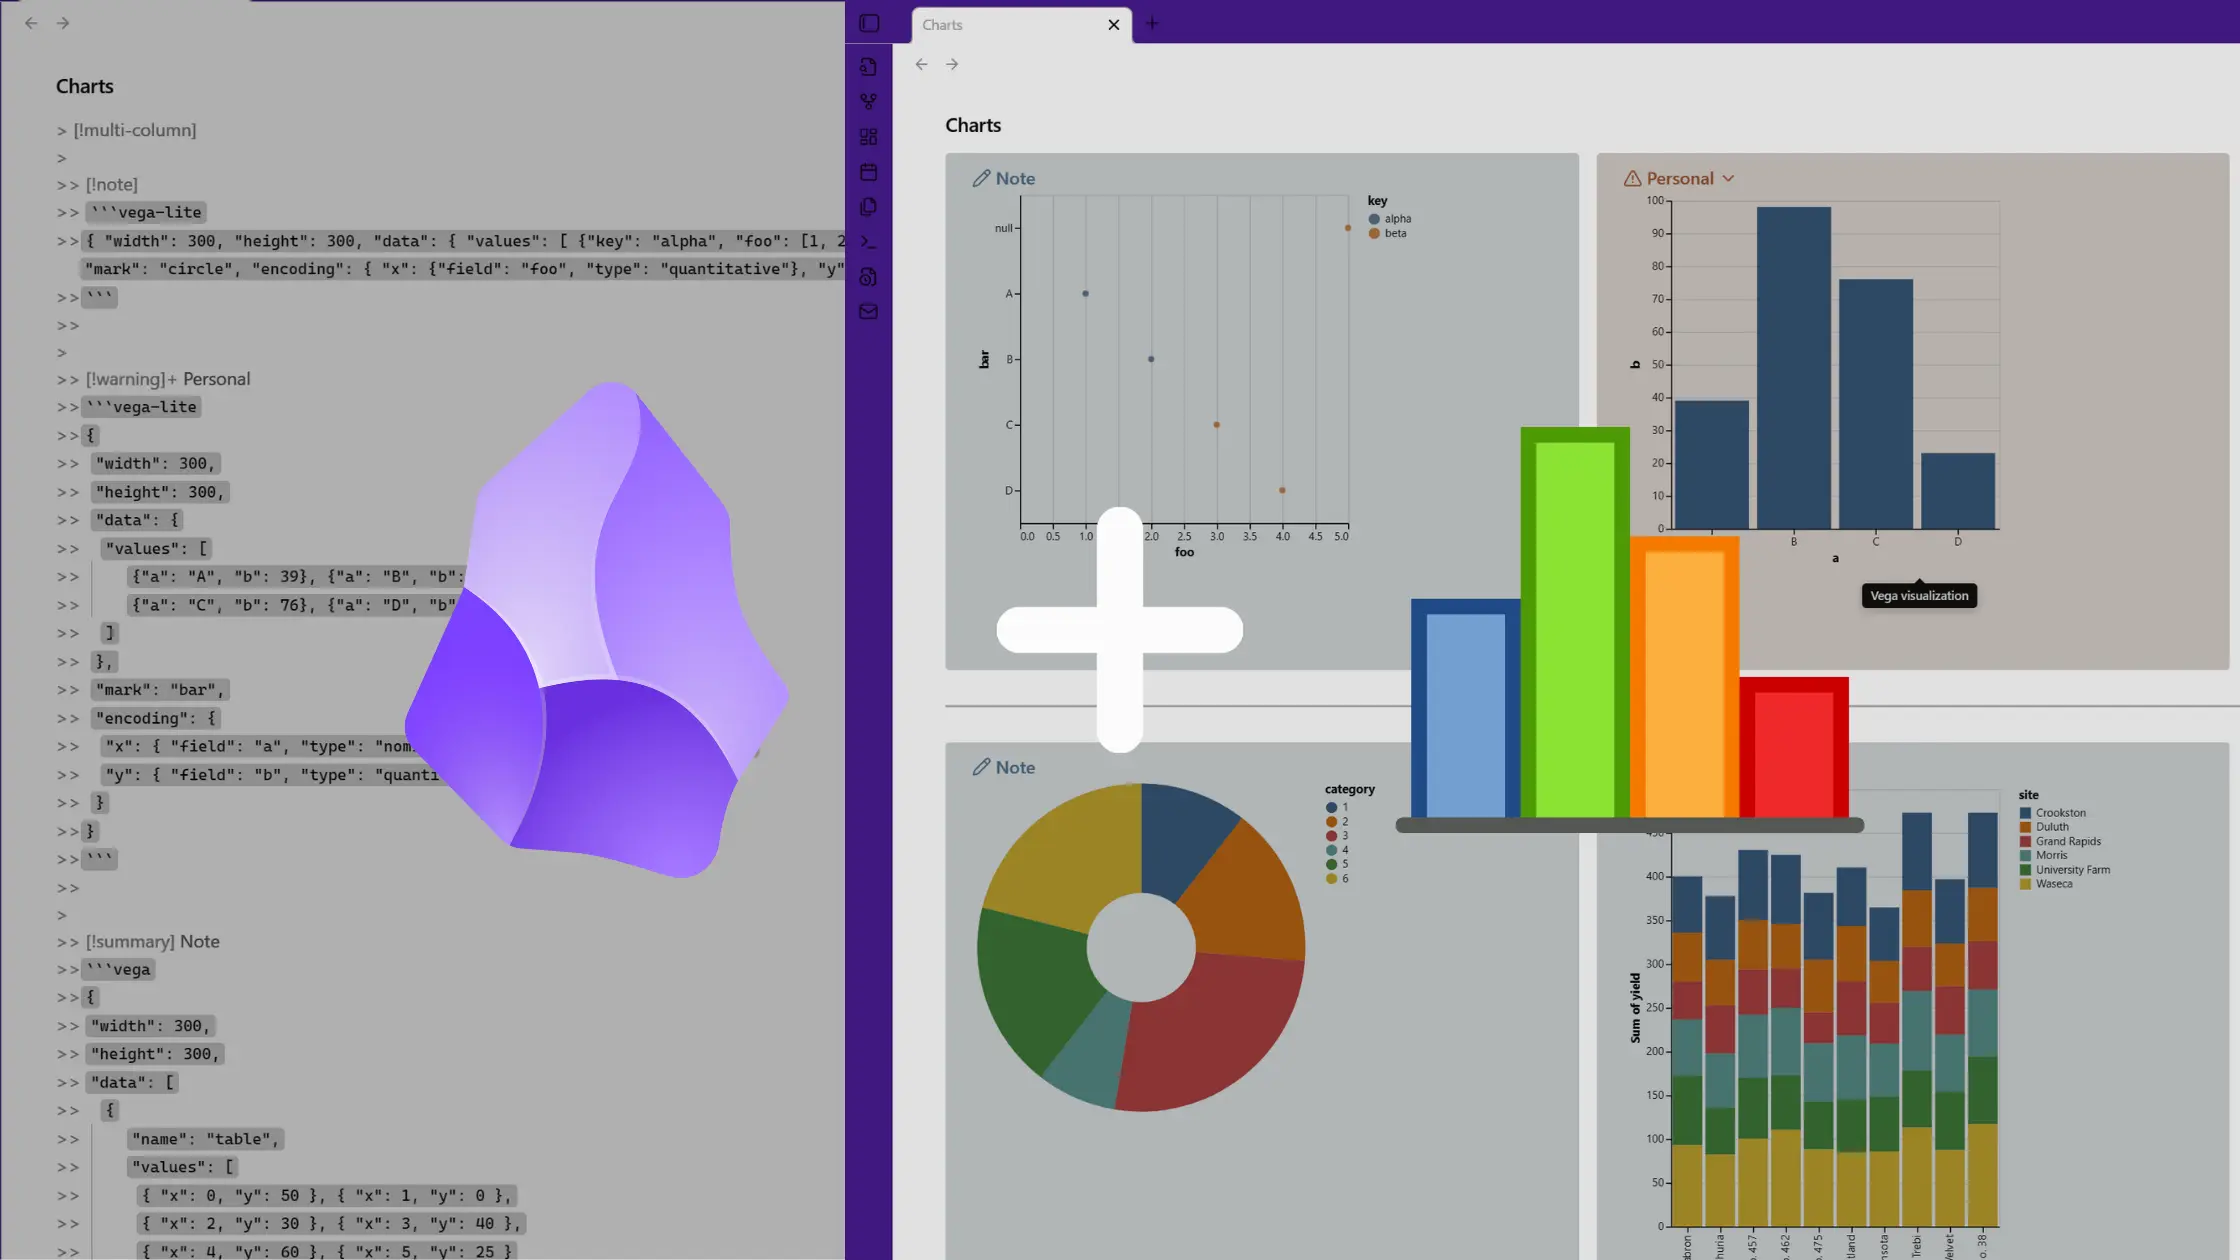
Plain text reaches its limits quickly. When tracking metrics, documenting API performance, or mapping workflows, walls of text often fail. Charts step in to turn scattered numbers into patterns and technical noise into clarity.
For anyone working in tech or data heavy fields, Obsidian's chart plugins are game changers. They let you embed bar graphs, timelines, pie charts, and interactive diagrams directly in your markdown. You can pull from JSON or CSV, create mermaid diagrams for sequence flows, or use chart.js to plot complex datasets all without leaving your notes.
These tools turn Obsidian from a text editor into a lightweight data dashboard. They're ideal for developers, analysts, researchers, and anyone who needs to visualize relationships or trends without bouncing between apps.
The Vega Visualizations plugin allows users to create customizable data visualizations within Obsidian using Vega or Vega-Lite specifications written in JSON format. The plugin supports a variety of charts and plots, such as bar charts and line charts, which are rendered directly within Obsidian notes. With this plugin, you can easily embed complex visualizations into your notes by simply adding a code block with the appropriate specification. It's ideal for users who need to visualize data in a flexible, interactive manner without leaving the note-taking environment.
The Financial Doc plugin is a powerful tool for Obsidian users who work with CSV files. With this plugin, you can open and edit your CSV files directly within Obsidian, and use the data to generate charts and reports. The plugin supports various chart types, including line, pie, and radar charts, making it easy to visualize your financial data. You can also evaluate mathematical expressions directly in the value column, thanks to the integration with mathjs. The plugin is highly configurable, allowing you to tailor its behavior to your specific needs. Additionally, it works seamlessly on both desktop and mobile devices.
3. Size History
The Size History plugin is a unique addition to Obsidian's plugin ecosystem, offering users a visual representation of their vault's growth over time. With this plugin, you'll be able to admire your progress with a charming "hand-drawn" line chart that displays the number of files in your vault by day. The plugin cleverly recreates historical data by analyzing file creation times, giving you a comprehensive view of your vault's evolution. While it doesn't account for deleted files prior to installation, it will continue to track changes from now on, providing valuable insights into your Obsidian usage habits.
The TinyChart plugin! This exciting new release allows you to create custom, interactive charts within your Obsidian notes. With TinyChart, you can easily visualize data and track progress without leaving the comfort of your note-taking environment. The plugin offers a range of customization options, from chart types and colors to sizes and layouts. Perfect for students, researchers, and anyone who wants to stay organized and on top of their game.
The Charts plugin for Obsidian brings interactive visualizations to your notes, enabling you to explore and understand complex information in a more engaging way. With this plugin, you can create charts that dynamically update based on your note content, helping you to identify patterns, trends, and relationships. Perfect for data-driven research, brainstorming sessions, or simply visualizing your thoughts, the Charts plugin adds a new dimension to your Obsidian experience.
The Charts View plugin enables users to create a wide variety of interactive data visualizations within Obsidian. It supports multiple chart types, including bar, pie, radar, treemap, word cloud, dual-axis, and organization tree graphs. Users can generate charts from CSV files, internal note data, or Dataview queries. The plugin provides a chart wizard for easy configuration and customization of chart elements, such as colors, labels, and tooltips. With options for importing CSV files, combining multiple datasets, and enabling search interactions within charts, users can create dynamic and insightful visualizations. Charts View also integrates seamlessly with the Dataview plugin, allowing users to visualize note data directly. This plugin is ideal for those looking to transform their notes into visually appealing and interactive data dashboards within Obsidian.
The Plotly plugin allows users to embed interactive Plotly charts into Obsidian notes for data visualization. It supports creating static charts with YAML or JSON payloads directly within markdown blocks using a `plotly` block. Advanced users can leverage the DataViewJS block for JavaScript-based charts, enabling dynamic visualizations and integration with note data through the DataView API. This plugin is ideal for users who want to visualize data effectively while working within the Obsidian environment, offering flexibility for both static and dynamic charting needs.
The SQLSeal Charts plugin extends SQLSeal by enabling data visualization through a variety of chart types. It integrates with ECharts, allowing users to transform SQL query results into line, bar, pie, scatter, and heatmap charts within Obsidian. By leveraging SQLSeal's querying capabilities, users can structure and manipulate data before displaying it graphically. The plugin provides built-in functions to process and refine datasets, making it suitable for users who want to analyze structured information directly in their notes.
The SQLite DB plugin allows users to interact with SQLite databases directly within Obsidian. It enables executing SQL queries, filtering data, and rendering query results in a structured format. Users can inspect table structures, extract data into notes, and generate visualizations such as pie, bar, and line charts. The plugin supports advanced filtering options, including date ranges and multiple conditions, making it useful for managing structured information within Obsidian.
The Daily Note Metrics plugin provides an interactive dashboard to visualize habits and tag usage in Obsidian's daily notes. It tracks completed tasks using checkboxes and organizes tag-based data into dynamic charts. Users can filter data by weekly, monthly, or yearly periods and refresh the dashboard manually. The plugin supports both single and combo tags, offering a comprehensive view of note activity. With automatic updates and structured parsing, it helps users monitor productivity and trends over time.